Get tomorrow's AI & engineering digest in your inbox — hand-picked, summarized, and always spam-free.
TLDR
Learned execution graphs represent request processing as DAGs to detect anomalies and drifts in API systems. By establishing baselines and comparing execution traces, the system identifies structural, volume, and covariate drifts, enabling faster root cause analysis and automated actions. The approach reduces mean time to discovery and false alarms through fine-tuned thresholds and client-specific baselines.
Key points
Execution graphs model request processing as a DAG, providing ordered execution and context tracking across services.
Baselines are established for end-to-end request execution; deviations trigger tiered checks to localize issues.
Drifts are categorized into structural (new/removed nodes), volume (scaling needs), and covariate (client mix changes), each requiring different responses.
OpenTelemetry feeds trace data into the system, enabling real-time anomaly detection and root cause analysis.
The approach reduces mean time to discovery by using single-window comparison instead of multiple windows.
Fine-tuning baselines per client and endpoint reduces false alarms and noise from varying request patterns.
Automated actions are rolled out gradually (e.g., 5-10% of nodes) after risk assessment and monitoring.
Explainability of data is emphasized to support informed decision-making and system understanding.
Receive the day's most important AI & engineering updates in one concise email. No spam.
Transcript (captions)
[music] Hi. Uh thanks thanks and uh hope everyone is out of uh the lunch coma and we'll survive this talk. So uh yeah myself Ritik I uh lead the payments team in uh JP Morgan and uh today I'll be talking about learn execution graphs how these graphs can help to uh detect any anomaly and uh drifts also how we can automate few things around that and uh you know u uh at the same time if we can reduce the manual you know detection work and uh going on that side uh so whenever we hear about graph uh there are persistence graph and property graphs uh which Neo4j and you know other products uh we use for them we query those uh graphs and get the answers out of it what I'm talking about today is execution graph. It's short-lived graph. Uh and idea here is holistically try to identify how the request processing happens and if there is any deviation on that and how to detect that and how to fix that.
So here is a simple example. Uh say we have set of applications. uh you have one edge layer uh the first layer where you know request comes in and then uh you have some gateways uh if k is there you have ingress layer on top of it then authentication authorization happens after that there is some orchestration layer and uh few other systems which could be called in parallel uh once everything is done you are notifying your client that what's the update on that request right So here the idea is representing the uh overall request processing as DAG and using tag simplifies most of the things here. one now you know that uh in what order service execution will be happening right so that's one of the thing the other thing is uh you know the context that in at what node what context will be there and what will be passed to the next node uh in that way it will be very um u ordered and simplified u uh simply can be represented uh there are few other uh use cases could be uh in terms of retries and uh the loops etc. uh the idea here is uh every loop uh to put in the graph as a separate entity itself.
So uh in that way it could be tracked uh easily. how we can make this system uh more uh reliable at the same time not using uh most of the resources right so in the tier one check or it's your first check it's like uh going to airport and you you you know it's just boarding pass is some someone is looking at the boarding pass and let you go so uh now if you know the baseline of your request execution end to end if uh everything looks Good. You don't need to go to the tier two uh or next tier of check. Right? Once if you find that there is some delay.
So now you need to check that what changed here. One of the uh the drift here could be because of the structural change. So if any new node or new step added which you are not aware of that could be one of the thing or one of the step which is removed that could be the another reason right. Uh once you know about that then further uh further analysis could be done uh in terms of scale deviations uh divergence and uh exponential ma uh so in simpler terms if you know that client A's request is taking this much time normally and uh client B's request could take might take more time than the client A um because of say one client is local to you and one client is uh you know the request is coming from outside and uh there are a few more checks needs to be done. So in in that case the baseline will change client to client and now you know that uh what your threshold it and uh how you can u reduce the noise of such alerts.
Uh so here the idea is very simple. First you uh represent the entire request processing as DAG. You come up with the baseline. You find out the deviation and then you try to find out where exactly the issue is. Once you localize that then you compare that based on your system that whether it is uh within the threshold or not.
If it is within the threshold yeah you don't need to u you know do the alerts or automate anything but if it is out of the threshold then certain action needs to be taken. Uh coming back to our example here say overall uh request processing from all the different nodes within our system uh is happening but somehow the foreign transaction uh rate service is taking more time than the usual. Now if you represented this whole uh request processing in multiple nodes you know where the problem is or where the issue is and correspondingly you will uh you know now you can uh exactly know where the problem is. So you can solve it uh that what how to uh how FX system or what all different uh cases were there in the past where FX FX rate system was failing. Here is one of the example uh for benchmark uh open telemetry and that star bench were used and say for 7 days of the time millions of uh traces were um you know injected or uh in the system then you inject the problem or uh anomaly there and based on that you train your system before anything goes on live.
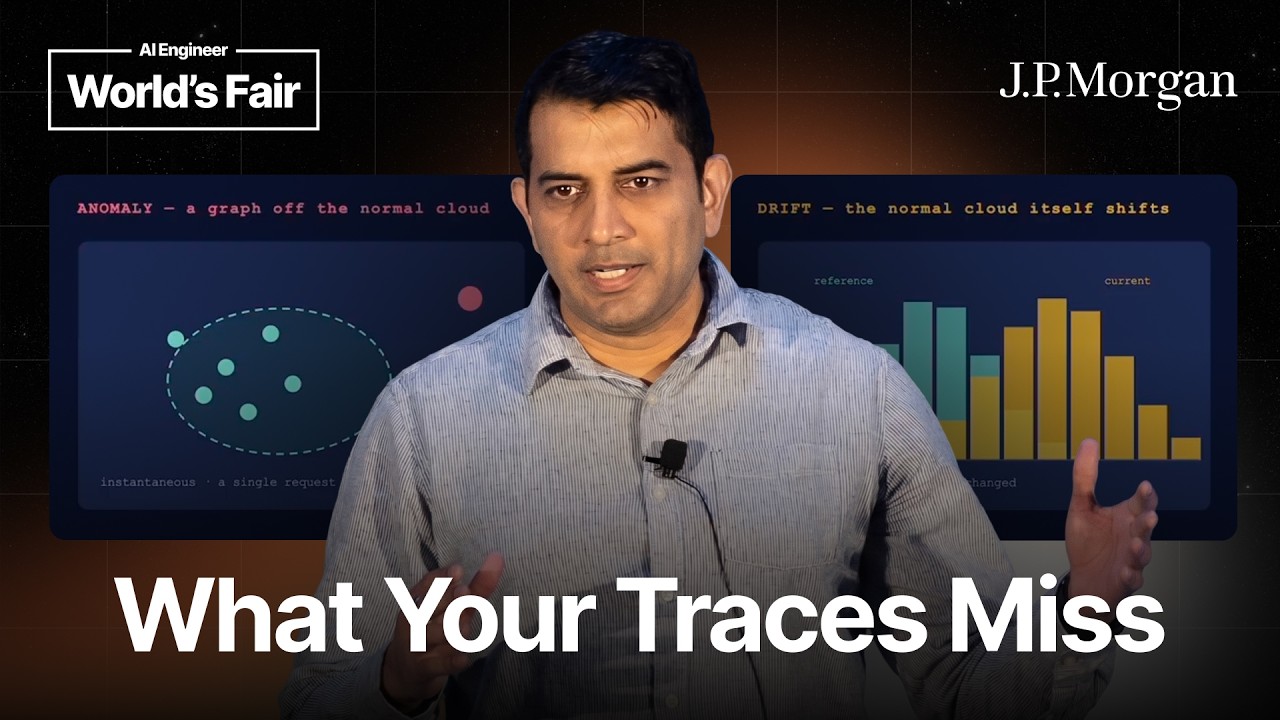
So uh again uh basic thing here is what is anomaly and what is drift right? So say you are driving from your home to office every day and uh one of and usually it takes 1 hour but uh one fine day it took you more time than 1 hour. Uh the reason might be some traffic or you know um car accident or anything. But uh he this is one of the incidents and uh based on your system and criticality of your system uh you can decide how to address that. The other part is one fine day you are uh taking sip of coffee around 4 p.m.
and realized that a year back it used to take one hour for you from your home to office but nowadays it it is taking 20 more minutes right so what happened in Bay Area in number of carc so this is over the time what you are seeing is pattern changed and that's where you might need to come up with uh the new baseline itself so uh that's that's the drift that over the time you start seeing some delays or you know some uh performance deviation then once you know that there is a drift uh you can further categorize it first category is structural uh so say you somehow in the system a new node is added or one of the node is removed as I mentioned earlier for example you like uh again you know there is a shop where you like uh drinking coffee and uh one fine day they are ask start asking you about membership so they added one more uh step in it now every day they might ask you for hey do you have membership with us if you have then there is there are a special discount for you if you don't have membership then the regular prices will be there so in that way uh you know same way in our service processing or a request processing if new node is added that means uh Now you need to consider that step also in your old baselines and new alerts. The other one is uh say because of the volume of request uh one of your service is taking more time or it's not you know u cannot serve the request or the volume which you are expecting now over the time. So yeah, such kind of drifts you might need to treat differently because now you need either you need to scale up those services or instances of those services and or you need to either make it asynchronous call or based on based on the use case you know what whatever uh works there uh co-variate is a different uh one of the category say when you started the business uh you were seeing around 60% of local request but uh and 40% uh request from you know out of the country and that's where you might need to change the currency or you know one extra step is there so you now you know that what is the baseline for your uh request in US dollar but uh what is the baseline for uh any of the other currency over the time what happens is your product is so popular that you started getting more uh request from the outside. So nothing changed. Your system is working fine, right?
But now you need to come up with the criteria and reassess your baselines again. Sorry here where uh either you need to come up with two different uh you know uh graphs to compare that one is for local and one is for um outside uh request from outside or what you can do is you can increase your uh average request time baseline. So once you know the pattern uh you know the solution. So uh that's where you need to categorize uh this drifts. One category could be for the same request uh now you are seeing the different behavior itself.
Then probably if and when it's needed you might need to roll back such uh changes or either you need to reconsider that. So where I'm going with this is in that way you need to re-evaluate and reassess your system before uh identifying that what action needs to be taken. This whole talk is mostly about statistical uh uh you know part of uh the solution. uh it's it's uh part of bigger neuro uh specific uh um algorithms and system in a way but this is just one of the module which uh I'm talking about here now so once you know the drift or deviation and here is the simple uh tag for how uh this whole system would work. Open telemetry will will keep feeding the data.
Once you have that data, uh root cause analysis could be taken based on uh once your system knows about all the data points. Now you know which type of drift it is and what solution could be there. Then you identify what action needs to be taken. Once you know what action needs to be taken further you need to also uh find out that what is the risk if we go with this approach or if we automate this uh solution right so once you know the risk either you can go with uh roll out that system uh um solution for say 5% or 10% of your uh machines monitor it verify everything looks good and then you roll out for your 100% of the nodes Here are a couple of example. uh again uh say generally overall request processing takes 700 millisecond but uh on the left side what you are seeing is u in the graph approach itself how it could help you is uh now you know that uh which specific node is taking more time suddenly you get alert on that or otherwise if you are seeing that uh the delay is all across then something which is common which you need to fix here all these things because in the payments and the real time uh payment processing we want to keep it very faster right so we don't want delay the actual request processing the solution which we generally use uh everyone in the industry is asynchronously feeding the data to uh opal telemetry from there u some kafka could be used and stream assessment uh could be used on top of it.
There could be two different paths. One is say hot path where you can take a decision very faster and uh um work on the solution or automate that solution. The other one is more recon kind of solution where it might take some time but more more accurate could it could be [snorts] few of uh uh other challenges which uh we need to fine-tune here. So all I talked about is hey you have seven nodes in your system and every node is feeding the data to your uh telemetry. What if one of the system is delaying the event?
Should we consider it as a structural change because now what you have data in your system is for six nodes and the seven uh uh the data from the seven node is delayed already. So we need to fine-tune that uh that those numbers also that when to consider that uh there is a structural change or not. So basically here we are uh trying to reduce uh any false alarm based on the use cases and here in this use case u we should go with tail by based system because what we are trying to track here is uh or in this specific example is when the service request started and when it ended right so uh for each and every node the other part is the cold start uh if there is a new endpoint consider the new baseline don't make it very generic. So in that way on the detect side any MMD or KL uh could be used uh and once you confirm uh this with admin and then classify uh the problem uh that will give you where what exact solution needs to be done and next step whatever uh if we can automate it we'll automate it. So what we see uh in general here is uh mean time to uh discovery reduced a lot to make it very real time.
Instead of comparing or waiting for multiple windows of uh the time duration it was uh a single window which we uh uh you know which we identified uh helped a lot uh to fix the issues fast. uh few of other things which we might need to make sure. One is uh the labels when it comes to uh learnings the labels helps a lot but uh at the same time uh we need to make sure that uh the system is very fine tuned in terms of that. Uh the other part is instead of saying that all the post requests should have you know this is a baseline for all the post request uh try to come up with very uh a number which works for you post for payments for real-time payment or post for wire payments or u based on you know uh your use cases. So that that would help a lot.
Um again uh if anything is u um you are considering a structural change or something uh the window uh should be well defined for each and every client. In my previous uh example which I talked about uh if you can come up with the new baseline would really help uh to reduce the noise. Uh explanability uh all the data should be well explained. If you go to the doctor and doctor says your health score is 22, it doesn't make much sense to you. So, uh yeah, the actual uh more data uh can explain you know more things to you and uh can we can take the informative decision on top of it.
Uh whole system should be aware of the new deployment. Uh so u u based on that you can take either roll back decision or not. So yeah that's that's about it. Uh thanks everyone. Uh I would like to connect with you all.
Uh here is my LinkedIn. I can answer it. [music]