Enjoying this issue?
Get tomorrow's AI & engineering digest in your inbox — hand-picked, summarized, and always spam-free.
TLDR
A multimodal training pipeline's GPU utilization can be raised from 15% to 90% by fixing data loading and transfer bottlenecks rather than optimizing the model itself. The main improvements came from adding concurrency for image processing, pre-fetching data ahead of training, and using Ray's object store to avoid expensive data copies. At scale, spreading workers across nodes and enabling zero-copy retrieval prevented network bottlenecks that emerged after earlier fixes.
Key points
Baseline pipeline spent 85% of time waiting on data, resulting in only 15% GPU utilization.
Adding concurrency with async I/O and Ray actors reduced data fetch time per batch by 25%.
Pre-fetching with a background queue eliminated data fetch time, achieving near-zero wait per batch.
Using Ray object store for zero-copy references reduced data transport overhead from repeated pickling.
At scale, enabling zero-copy retrieval and spread scheduling across nodes improved throughput by an additional 50%.
Tools mentioned
Techniques
- asynchronous programming
- threading
- multiprocessing (Ray actors)
- pre-fetching
- object store (zero-copy)
- spread scheduling
- zero-copy retrieval
- data parallelism
- image preprocessing (resizing, normalization)
- tokenization
Stop scrolling. Start reading smarter.
Receive the day's most important AI & engineering updates in one concise email. No spam.
Transcript (captions)
[music] Hello everyone. Thank you for joining me here. Um yeah, today I'm going to talk about ray actors, vision tokens, and the gill.
um engineering a multimodal SFT data pipeline that keeps the GPUs busy. So there's a lot of talk about you know how to optimize training paradigms. Um but I
want to give a different perspective on the whole ecosystem of what it takes to get a model trained. Um and so the question I'm going to be asking here is does your training loop really depend on
the GPUs right now? Is it blocked on the GPUs? And I think we're going to learn that we're going to see in this experiment that the hardest part of optimizing multimodal train throughput
is not necessarily kernel optimization. It is making sure that the G GPUs are constantly fed with data. So let's go over the overview of what this topic what this talk will be about.
Anyway, so we will establish a baseline multimodal training pipeline um and then we will encounter bottlenecks and then address them one at a time. So loosely they are one concurrency how fast can
you process one image before feeding it to the model two pre-fetching how can we make sure that we have data on demand three um how can we minimize data copies across different processes and four f
additional framework optimizations um so just tweaking your bells and whistles um yeah so let's set up our premise We all know that GPUs incur expensive costs and are generally want to maximize their
utilization while we have them at hand. Multimodal processing is different than text only um because there's a lot of CPU inensive operations that have to happen before you actually feed the
model um the data. So whether that is um you know loading resizing or normalizing images using like a library like pill for audio you do a lot of loading and cropping you can use like numpy arrays
and then videos are some sort of combination of both um and then it's also true that usually your training clusters have a lot more CPUs than GPUs at hand yet the GPU is what is starving
in this pipeline. So today we're going to introduce this equation called like weight time ratio which is generally I formulated as like the time it takes to prep your data and transfer it to the
GPUs. Um and then we divide all of that by the time it takes to do both of those and the train as well. So basically the denominator is like your total pipeline. Um and we're going to see that during
our run we will go from a utilization of 15% to utilization of 90%. So our baseline has like 85% of its spends 85% of its time um backed on data acquisition whereas after we do these
optimizations less than 10 and so for the scope of this talk GPUs are not the goal. It's making sure that the data is never the bottleneck is the goal. And so here's a little bit of background as to
like what our stack will look like. um we kind of take like a Quen 3VL based model um kind of try to train it on the paradigms of chat VQA and like multi-term VLM uh conversations. So to
recap before the GPUs do any math um we have to load the data we have to transform the data and then we have to we have to transport it to the GPUs. Okay, this is a this is a overview of
what our data actually looks like. So, we will be using JSON L files. Um, and then images are linked relatively uh to where the example lives. And then we're going to assume that our data is just
stored in S3. Um, in this example, for example, it seems like that image 33471.jpeg seems to be a picture of like a blue bus.
Um, yeah. So this is our system layout. On the left we have a data generator which is responsible for the data loading, data transforming and data transporting. Um and the that's like
labeled as like fan out to the mega megatron data parallel ranks. Um so the parallel ranks receive partitions of the data as decided by the coordinator. Um it collates it performs forward pass and
backwards pass on this data. So, Megatron takes care of optimizing the model weights across the DP ranks. And we're going to assume that it's like a it's kind of it is kind of working as a
black box. Um, so let's start with the naive baseline path. So for each example, we fetch the images from object store. Um, we kind of like we tokenize it, we
resize it, we write resize the images, normalize them, and then feed them to the model. Um yeah and then when we do that we can see that there's serial
operations in the red which is namely getting all the images one by one and then processing them one by one. So if your if your trainer is asking for a batch size of like 256 then you have to
serially process all these images and then we can see that our train time is somewhere between 15 to 20 seconds. uh however the data the time spent to actually fetch the data is more than a
100 seconds. So that's why we result in only 15% utilization of our GPUs. Um and then you can even see a profiling flame graph that we spend most of the time doing S3 loads and then you can see a
long a little tail at the end about like loading the actual image on the pill uh library. So okay, solution one, let's try to add some concurrency to this. Instead of
those red singular uh you know serial processes, uh let's try to parallelize it by kind of having like a worker pool. So when you request 256 examples, maybe let's just process all of those at once.
Um yeah, so for example, for example, we have two costs. One is fetching the images, two is processing. So that's like decoding, vision pre-processing,
and then tokenizing your text. Um, samples are very are independent. So this just means it's like embarrassingly parallelizable. Um, and so yeah, you have a design
decisions here. What forms of concurrency do you want? So there's asynchronous programming, uh, which is suitable for like IO work such as making SQL queries or like performing network
requests. There's threads uh which you can use for like CPU intensive uh workloads that relinquish the Python gill like the global interpreter lock. Um so this it's not straightforward what
operations actually release the lock. So you have to do a little more of your investigation but common uses are like using hugging face transformers tokenizers
using the pill transforms API or like some pandas operations processes um are more heavyweight but also provide total isolation between your workload so you can leverage multiple cores on your
machine as you finish your work. Um, yeah, doing a deep dive on the right solution would warrant its own talk, but like there's plenty of online resources that can help you decide for your use
case. What's important for our solution is that we need to match our bottleneck. Not simply going with a lever that's worked for us before. Um, so we'll choose async IO for fetching images here
and then use ray actors as our processors uh as our process multipprocessing library. Um, ray actors are essentially the same as like general processes, but they offer us APIs to
communicate across workers that just make it so that we don't have to reinvent the wheel. So, yeah, your process is only as slow as your slowest link. Um, and we can see that our weight
time ratio has gone down. Um, on the second example, which is in the pink, uh, you can see that the time spent fetching data per batch has gone basically, yeah, around like around like
40 40 seconds. Um, so this is this gives us a 25% speed up. However, you yeah that's the as you can see the there's a huge gap that starts generating especially as we're
going through many many steps. Um, so can we somehow limit our bottleneck of waiting on the trainer to request before provisioning our worker pool to fetch the data? So can we just like
preemptively fetch our data? Um so we came up with solution two which was that we have a background thread that fills up a queue ahead of time and it's always stays ahead of the consumer
which means that you your producer is producing examples at a multiplier of your tra of your consumer and so the trainer is never bottlenecked on actually requesting the
data. When it requests data it's it is available on demand. There's a caveat to prefetching. It makes your model and data loader checkpointing and resumption like a little intricate of a process and
it can also suffer from a cold start period in which your queue is actually getting filled up uh so it can be ready for training. Um but uh if you work around those those details I think
pre-fetching is a is a great idea. Um yeah, so I think making sure your producer is always ahead of your consumer will be will pay great dividends for you here.
Um unsurprisingly, we achieved close to 0 seconds of data fetching and processing per batch because we've already fetched data and processed it way before the trainer even needs it. Um
and so we've effectively solved both the data load and the transform bottlenecks. So after these two mitigations, we thought we were done. throughput up GPUs fed however we observe that the data
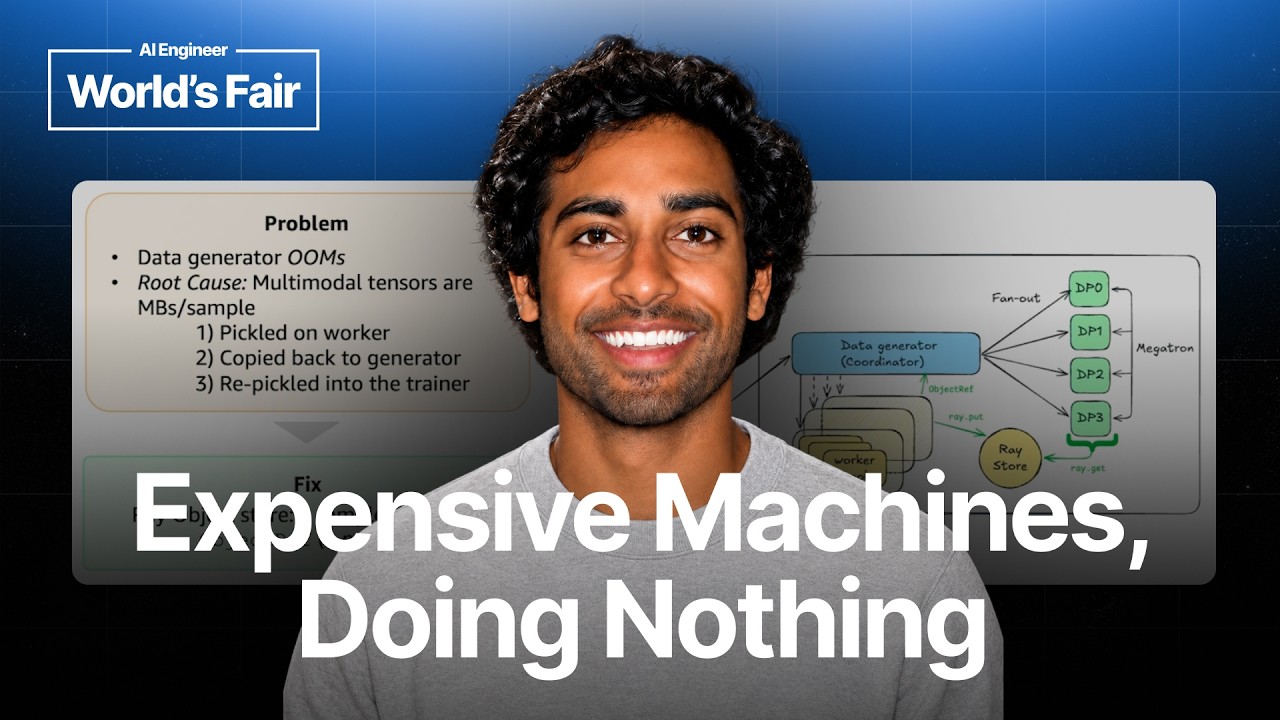
transport costs still linger in fact they've gone up so every sample transfers a large amount of like image arrays across process boundaries multiple times every sample is pickled
on the worker copied to the coordinator and then repickled onto the trainer per sample per step we have a mem copy that nobody really asked for so what h how this manifest is that your
data generator can often oo. Um, and so multimodal tensors are huge. They're megabytes per sample. Um, and so by default, every sample is returned by value, which means this that these
expensive arrays are copied over from process to process. So a fix for this, you can come up with an object store. Um, this is a nice convenience method of that array provides you. Each sample
carries a object reference which is just a pointer to the data. Um and then the driver just holds the pointer. The tensor never round trips to the head node. Um and the Megatron data parallel
ranks they can just directly call the race store to fetch the data as they need. So with every choice of your parallelism and concurrency solution, you always
have to think about the commu added communication costs. So plan wisely around that. Okay. Yeah. And we were able to eliminate an extraneous like put object uh kind of call that our
prefetcher solution had that we did not have to deal with by using the ray store. And we can see that our communication costs go down and the ratio of the time spent waiting also
goes down. So to recap, we took a serial baseline. We added concurrency for data loading and processing. We added pre-fetching to stay ahead of training requests and we added the race store to
minimize data transfer. We went from a baseline weight ratio of 85% to 20%. And you can see that the saw to uh pattern that you see in the top graph is alleviated uh to a large extent which
means that our utilization of the GPUs has gone up. So when we're scaling up and now that we have like a good multimodal training pipeline, let's try to scale it up to
like a production run. While doing that, we observed that our weight time ratio for the same pipeline went up when all we did was scale some numbers. So we just added four times the
data parallel rings. We added like 200 data streams and then batch size is x by4. Um so it turns out that since the data generator and the worker pool are colllocated for fast data transfer
what happens is that there's a bottleneck on the network interface card of that of that node. Uh which means that while we're packing all of this working and processing into specific
nodes that their network throughput is not able to keep up with the demand of the training pipeline. Um so at this point we did a little bit of digging into the frameworks that we
are using and we saw that by default Ray schedules workers on this it prefers to schedule workers on the same nodes and colllocate workers which means that it's easy to bottleneck one machine before
you move to another machine. So what we did was consider a possibility where we disagregate this whole process where workers are spread across multiple nodes. Um so they can do their own image
processing and storing and in a lazy just in time manner are retrieved and used by our DP rings. So yeah to re and then so these are the two parameter two flags that we kind of
tuned one is a zero copy retrieval and second is a spread scheduling mechanism. Um neither of these actually helped in a small scale experiment but together they had um a synergistic effect in a large
scale experiment. Um yeah so config can lose a config can do poorly at a small scale but can do really good at a larger scale. So you should always think about how to ablate
across your your scaling ladders. And these were the two flags that ended up making a huge difference uh in how how fast our data processing pipeline was. And so now this is the final
pipeline that we've accomplished a concurrent eager um and a data access pattern aware system that shares the training across loads and enables that GAPU stay warm while providing
smoothness and stability in training. Overall we achieved a 50% additional throughput at scale just from these two flags. It's the same knob opposite verdict
set by the bottleneck. So these are the learnings we get from this talk if nothing else. Um GPUs are expensive but sometimes the biggest battles happen outside of the GPU. So
first ask yourself are you CPU bound or GPU bound? Are you IO bound or computebound? And then solving one bottleneck often exposes another. So first it was throughput for us then it
became weight time then it became memory then it became retrieval cost. Um, classic moves are not the end. You know, parallelism and prefetching matter and I think a lot of content has like
covered this. Uh, but so do the semantics of the frameworks that you're using and the and the constraints that you're dealing with and scale always changes the answer. Tuning parameters
like zero copy waste um and spreading workers become important only at larger scales and they may not manifest as obvious improvements at smaller levels. Overall, profiling your baseline helps
you move the needle. Um, yeah, thank you everyone for attending the talk. Uh, if you have any questions, I'm happy to answer them. Thanks.